ENG | Plotting Sensor Data: The SeQueL
Automating periodic plots and backup using systemd timers.

In previous chapter we got somewhat familiar with plotting data from PostgreSQL database.
In this chapter we will show how to update data using systemd timers - that were already used for Raspberry Pi timelapse and plot some more graphs using gnuplot as a static content for web server - which I made using Python/Flask and which is responisble for data uploads and dashboard.
This article has somewhat lower quality and it’s mostly showcasing scripts.
There is one missing piece: python server script which must be executed with
nohupwhen server starts. Or as a systemd service, otherwise it can be forgotten after server restart.
Gnuplot Gallery
To be honest, I like(d) gnuplot for good looking graphs by default. But after working with it for a while, I somewhat changed my opinion on gnuplot due to lack of flexibility and even good examples. AI tools are also not very helpful and they provided mostly misleading guidance.
Nonetheless here are a few scripts and a gallery.
Here is a gallery of graphs and shell/psql/gnuplot code to generate them. Possibly newer version could be found on my github.
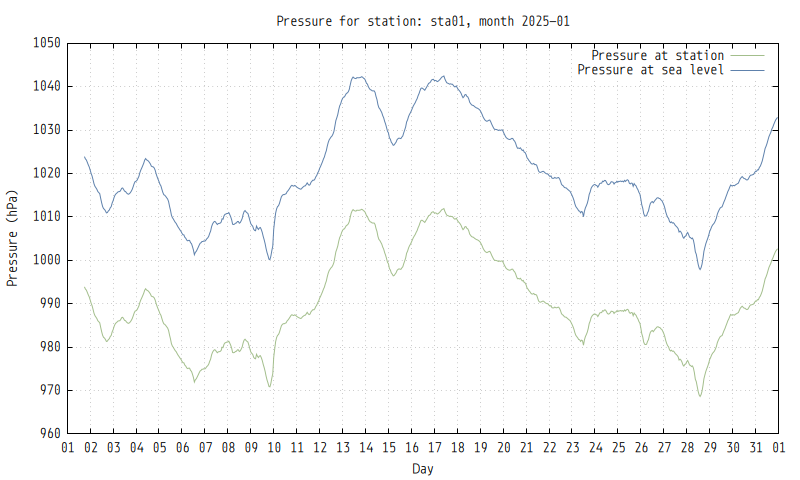
Pressure last month
1
2
3
4
5
6
7
8
9
10
11
12
13
14
15
16
17
18
19
20
21
22
23
24
25
26
27
28
29
30
31
32
33
34
35
36
37
38
39
40
41
42
43
44
45
46
47
48
49
50
51
52
53
54
55
#!/bin/sh

STATION_ID="sta01"
CSV_FILE="/tmp/weather-last-month.csv"
YEAR=$(date --date="$(date +'%Y-%m-%d') -1 day" +%Y)
MONTH=$(date --date="$(date +'%Y-%m-%d') -1 day" +%m)
NEXT_MONTH=$(date --date="$(date +'%Y-%m-%d') -1 day +1 month" +%m)
OUTPUT_FILE="/home/pavel/dev-py/pico_weather_station/server/assets/img/weather_${YEAR}_${MONTH}_${STATION_ID}_pressure.png"
LAST_DAY=$(cal $MONTH $YEAR | awk 'NF {DAYS = $NF}; END {print DAYS}')

SQL_QUERY=$(cat <<EOF
\copy (
  SELECT
    DATE_TRUNC('hour', timestamp) AS date_time,
    AVG(pressure_at_station)*.01   as pressure_at_station,
    AVG(pressure_at_sea_level)*.01 as pressure_at_sea_level
  FROM weather_data
  WHERE (station_id = '${STATION_ID}')
    AND (EXTRACT(YEAR  FROM TIMESTAMP) = ${YEAR})
    AND (EXTRACT(MONTH FROM TIMESTAMP) = ${MONTH})
  GROUP BY date_time
  ORDER BY date_time
) TO STDOUT WITH CSV HEADER
EOF
)

GNUPLOT_SCRIPT=$(cat <<EOF
set term pngcairo size 800,480 font "Monoid,8";
set datafile separator ',';
set xdata time;
set timefmt '%Y-%m-%d %H:%M:%S';
set format x '%d';
set grid;
set output "${OUTPUT_FILE}";
set ylabel "Pressure (hPa)";
set xlabel "Day";
set xrange [ "${YEAR}-${MONTH}-01 00:00:00" : "${YEAR}-${MONTH}-${LAST_DAY} 23:59:59" ];
set xtics "${YEAR}-${MONTH}-01 00:00:00", 86400;
set title 'Pressure for station: ${STATION_ID}, month ${YEAR}-${MONTH}';
plot "${CSV_FILE}" using 1:2 with lines title "Pressure at station" lc rgb "#a3be8c",
 "${CSV_FILE}" using 1:3 with lines title "Pressure at sea level" lc rgb "#5e81ac";
EOF
)

# Export data to CSV
psql -h ~/postgre-sockets -d weather_data -c "$SQL_QUERY" > "$CSV_FILE"

# Check if CSV export succeeded
if [ ! -s "$CSV_FILE" ]; then
  echo "Error: CSV file is empty or not created."
  exit 1
fi

gnuplot -e "$GNUPLOT_SCRIPT"
#echo "$GNUPLOT_SCRIPT" > .gnuplot
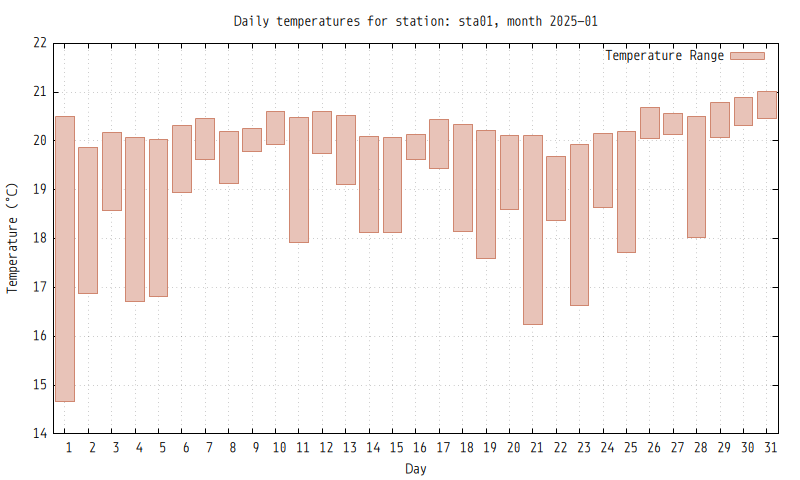
Temperature last month
1
2
3
4
5
6
7
8
9
10
11
12
13
14
15
16
17
18
19
20
21
22
23
24
25
26
27
28
29
30
31
32
33
34
35
36
37
38
39
40
41
42
43
44
45
46
47
48
49
50
51
52
53
#!/bin/sh

STATION_ID="sta01"
CSV_FILE="/tmp/weather-last-month.csv"
YEAR=$(date --date="$(date +'%Y-%m-%d') -1 day" +%Y)
MONTH=$(date --date="$(date +'%Y-%m-%d') -1 day" +%m)
#OUTPUT_FILE="/home/pavel/Pictures/weather_${YEAR}_${MONTH}_${STATION_ID}_temperature.png"
OUTPUT_FILE="/home/pavel/dev-py/pico_weather_station/server/assets/img/weather_${YEAR}_${MONTH}_${STATION_ID}_temperature.png"
LAST_DAY=$(cal $MONTH $YEAR | awk 'NF {DAYS = $NF}; END {print DAYS}')

SQL_QUERY=$(cat <<EOF
\copy (
  SELECT
    EXTRACT(DAY FROM timestamp) AS day,
    AVG(temperature) as avg_temperature,
    MIN(temperature) as min_temperature,
    MAX(temperature) as max_temperature
  FROM weather_data
  WHERE (station_id = '${STATION_ID}')
    AND (EXTRACT(YEAR  FROM TIMESTAMP) = ${YEAR})
    AND (EXTRACT(MONTH FROM TIMESTAMP) = ${MONTH})
  GROUP BY day
  ORDER BY day
) TO STDOUT WITH CSV HEADER
EOF
)

GNUPLOT_SCRIPT=$(cat <<EOF
set term pngcairo size 800,480 font "Monoid,8";
set datafile separator ',';
set grid ;
set xtics 1;
set xrange [0.5:${LAST_DAY}.5];
set xlabel "Day";
set output "${OUTPUT_FILE}";
set ylabel "Temperature (°C)";
set title 'Daily temperatures for station: ${STATION_ID}, month ${YEAR}-${MONTH}';
plot "${CSV_FILE}" using 1:((\$2+\$3)/2):(0.4):((\$3-\$2)/2) with boxxyerrorbars title "Temperature Range" lc rgb "#d08770" fs solid 0.5;
EOF
)
# set xrange [1:${LAST_DAY}];

# Export data to CSV
psql -h ~/postgre-sockets -d weather_data -c "$SQL_QUERY" > "$CSV_FILE"

# Check if CSV export succeeded
if [ ! -s "$CSV_FILE" ]; then
  echo "Error: CSV file is empty or not created."
  exit 1
fi

gnuplot -e "$GNUPLOT_SCRIPT"
#echo "$GNUPLOT_SCRIPT" > .gnuplot
Script for periodic timers, running more often are very similar to pressure graph and not included here.
Using systemd timers for static content updates
Systemd timers were already used for Raspberry Pi timelapse where they are somewhat described. Here I include just a scripts and a brief recap.
Periodic updates (recent data)
This timer is basically modification of timelapse timer with larger time interval and a different script.
1
2
3
4
5
6
7
8
9
10
[Unit]
Description="Weather station periodic timer"

[Timer]
OnCalendar=*:0/10
AccuracySec=60s
Persistent=false

[Install]
WantedBy=timers.target
1
2
3
4
5
6
7
[Unit]
Description="Weather station periodic service"

[Service]
Type=oneshot
ExecStart=/home/pavel/dev-py/pico_weather_station/server/update_recent.sh
WorkingDirectory=/home/pavel/dev-py/pico_weather_station/server/
Daily updates
This script runs daily in the night and updates long term stats and performs database backup.
1
2
3
4
5
6
7
8
9
10
[Unit]
Description="Weather station daily timer"

[Timer]
OnCalendar=*-*-* 00:00:20
AccuracySec=300s
Persistent=false

[Install]
WantedBy=timers.target
1
2
3
4
5
6
7
8
9
10
[Unit]
Description="Weather station daily service"
After=postgresql.service

[Service]
Type=oneshot
ExecStart=/home/pavel/dev-py/pico_weather_station/server/update_last_month_temperature.sh
ExecStart=/home/pavel/dev-py/pico_weather_station/server/update_last_month_pressure.sh
ExecStart=/bin/sh -c 'pg_dump -h /home/pavel/postgre-sockets -d weather_data | zstd -19 > /home/pavel/backup/weather_data-$(date +%%Y-%%m-%%d).sql.zstd'
WorkingDirectory=/home/pavel/dev-py/pico_weather_station/server/
Enabling timers
Here is how to start timers without going into explanation - it was already explained in the Raspberry Pi timelapse article.
1
2
3
4
5
6
7
8
9
10
11
12
13
14
15
16
17
18
19
20
21
22
23
[pavel@marten -=- /home/pavel/.config/systemd/user]$ systemctl --user enable --now weather-update-periodic.timer
Created symlink '/home/pavel/.config/systemd/user/timers.target.wants/weather-update-periodic.timer' → '/home/pavel/.config/systemd/user/weather-update-periodic.timer'.
[pavel@marten -=- /home/pavel/.config/systemd/user]$ systemctl --user enable --now weather-update-daily.timer
Created symlink '/home/pavel/.config/systemd/user/timers.target.wants/weather-update-daily.timer' → '/home/pavel/.config/systemd/user/weather-update-daily.timer'.
[pavel@marten -=- /home/pavel/.config/systemd/user]$ systemctl --user daemon-reload
[pavel@marten -=- /home/pavel/.config/systemd/user]$ systemctl --user status weather-update-periodic.timer
● weather-update-periodic.timer - "Weather station periodic timer"
     Loaded: loaded (/home/pavel/.config/systemd/user/weather-update-periodic.timer; enabled; preset: disabled)
     Active: active (waiting) since Thu 2025-01-23 20:29:36 CET; 1min 1s ago
 Invocation: 5c17860f4b6f430c958f56358814633c
    Trigger: Thu 2025-01-23 20:40:00 CET; 9min left
   Triggers: ● weather-update-periodic.service

Jan 23 20:29:36 marten systemd[1528]: Started weather-update-periodic.timer - "Weather station periodic timer".
[pavel@marten -=- /home/pavel/.config/systemd/user]$ systemctl --user status weather-update-daily.timer
● weather-update-daily.timer - "Weather station daily timer"
     Loaded: loaded (/home/pavel/.config/systemd/user/weather-update-daily.timer; enabled; preset: disabled)
     Active: active (waiting) since Thu 2025-01-23 20:29:50 CET; 9min ago
 Invocation: 9398c35404a742469e5104d4d004a0eb
    Trigger: Fri 2025-01-24 00:00:20 CET; 4h left
   Triggers: ● weather-update-daily.service

Jan 23 20:29:50 marten systemd[1528]: Started weather-update-daily.timer - "Weather station daily timer".
Testing daily timer
To test daily timer, you may run it manually and check status:
1
2
3
4
5
6
7
8
9
10
11
12
13
14
15
16
17
18
19
[pavel@marten -=- /home/pavel]$ systemctl --user start weather-update-daily.service
[pavel@marten -=- /home/pavel]$ systemctl --user status weather-update-daily.service
○ weather-update-daily.service - "Weather station daily service"
     Loaded: loaded (/home/pavel/.config/systemd/user/weather-update-daily.service; static)
    Drop-In: /usr/lib/systemd/user/service.d
             └─10-timeout-abort.conf
     Active: inactive (dead) since Thu 2025-01-23 21:50:39 CET; 1min 25s ago
 Invocation: 60130c045f3e47bea865708b4015bb8e
TriggeredBy: ● weather-update-daily.timer
    Process: 3836149 ExecStart=/home/pavel/dev-py/pico_weather_station/server/update_last_month_temperature.sh (code=exited, status=0/SUCCESS)
    Process: 3836166 ExecStart=/home/pavel/dev-py/pico_weather_station/server/update_last_month_pressure.sh (code=exited, status=0/SUCCESS)
    Process: 3836185 ExecStart=/bin/sh -c pg_dump -h /home/pavel/postgre-sockets -d weather_data | zstd -19 > /home/pavel/backup/weather_data-$(date +%Y-%m-%d).sql.zstd (code=exi>
   Main PID: 3836185 (code=exited, status=0/SUCCESS)
   Mem peak: 89.6M
        CPU: 2.621s

Jan 23 21:50:36 marten systemd[1528]: Starting weather-update-daily.service - "Weather station daily service"...
Jan 23 21:50:39 marten systemd[1528]: Finished weather-update-daily.service - "Weather station daily service".
Jan 23 21:50:39 marten systemd[1528]: weather-update-daily.service: Consumed 2.621s CPU time, 89.6M memory peak.
TODOs
- Export whole database and add to files for learning purposes
- Handling of missing data in gnuplot or SQL
- Scripts can be reduced to views
Links
Inspiration
- www.in-pocasi.cz - historic data for nearby amateur station
- www.chmi.cz - local airport, last 4 or 90 days history