ENG | Plotting Sensor Data, part I: Simplicity Über Alles
Plotting data without bloat: PostgreSQL, Gnuplot, Systemd is all you need. Period.

Introduction
When it comes to modern data pipelines, there are countless “enterprise-grade” solutions: Prometheus/InfluxDB + Grafana, RRDtool, Graphite, and a sea of Dockerized setups that promise to be the right solution and leading platform. Each one more complex than the last, each requiring its own ecosystem of dependencies and configurations. To hell with it.
All you need is PostgreSQL database, gnuplot and systemd - which you already have, like it or not.
This article assumes basic knowledge of SQL and Linux. My home server runs on Fedora, but I think guide will work on Raspberry Pi running Debian as well.
Honestly, at the start I did not know what to expect - I assumed that I would need Python to put data into database, to aggregate them and either to plot them or to export them into CSV for gnuplot. Turns out, PostgreSQL alone was far more powerful than I had imagined, handling JSON import and CSV export directly, even aggregating time-series data.
Now from weather station project, I have data in JSON Lines format:
1
2
3
{"station_id": "sta01", "time": "2025-01-07T19:25:10Z", "temperature": 20.85, "pressure": 98082.5, "humidity": 41.92, "time_of_arrival": "2025-01-07T19:25:13Z", "dew_point": 7.445809063077524, "sea_level_pressure": 101042.15400010579, "specific_humidity": 0.006576569910225681}
{"station_id": "sta01", "time": "2025-01-07T19:26:10Z", "temperature": 20.85, "pressure": 98087.9, "humidity": 41.99, "time_of_arrival": "2025-01-07T19:26:15Z", "dew_point": 7.47052585396672, "sea_level_pressure": 101047.71694590754, "specific_humidity": 0.006587231631598269}
{"station_id": "sta01", "time": "2025-01-07T19:27:10Z", "temperature": 20.83, "pressure": 98087.9, "humidity": 41.93, "time_of_arrival": "2025-01-07T19:27:14Z", "dew_point": 7.431221762806983, "sea_level_pressure": 101047.71694590754, "specific_humidity": 0.006569699631174833}
All I want is:
- Store my data in timeless format: Simple weather readings in JSON Lines format proved flexible and extensible.
- Process and visualize it: Aggregate stats, plot graphs.
- Serve the results: A simple, almost retro HTML page.
There are many overly complicated setups. I tried to explore PostgreSQL capabilities, knowing it has some support for time lines. It actually proved much more capable that I hoped - no conversion scripts in Python are even needed! But it will get better.
Install and setup PostgreSQL
Install PostgreSQL database
For Fedora, command is
1
sudo dnf install postgresql postgresql-server
Intialize folders
1
initdb -D ~/postgre-data
1
2
3
4
5
6
7
8
9
10
11
12
13
14
15
16
17
18
19
20
21
22
23
24
25
26
The files belonging to this database system will be owned by user "pavel".
This user must also own the server process.

The database cluster will be initialized with locale "en_US.UTF-8".
The default database encoding has accordingly been set to "UTF8".
The default text search configuration will be set to "english".

Data page checksums are disabled.

creating directory /home/pavel/postgre-data ... ok
creating subdirectories ... ok
selecting dynamic shared memory implementation ... posix
selecting default max_connections ... 100
selecting default shared_buffers ... 128MB
selecting default time zone ... Europe/Prague
creating configuration files ... ok
running bootstrap script ... ok
performing post-bootstrap initialization ... ok
syncing data to disk ... ok

initdb: warning: enabling "trust" authentication for local connections
initdb: hint: You can change this by editing pg_hba.conf or using the option -A, or --auth-local and --auth-host, the next time you run initdb.

Success. You can now start the database server using:

    pg_ctl -D /home/pavel/postgre-data -l logfile start
At this point we can almost run PostgreSQL server, but we will get there by learning from mistakes.
Configure systemd service
Create systemd service file:
1
2
3
4
5
6
7
8
9
10
11
12
13
[Unit]
Description=PostgreSQL database server
After=network.target

[Service]
Type=simple
WorkingDirectory=/home/pavel/postgre-data
ExecStart=/usr/bin/postgres -D /home/pavel/postgre-data
ExecStop=/usr/bin/pg_ctl _D /home/pavel/postgre-data stop
Restart=always

[Install]
WantedBy=default.target
TODO: notice sudo something –linger
Enable and Start service:
1
systemctl --user enable --now postgresql
If it fails, you can try
1
2
3
4
5
6
7
systemctl --user enable postgresql # Enable service
systemctl --user start postgresql  # Start service
systemctl --user status postgresql # Display status with last errors
vim ~/.config/systemd/user/postgresql.service  # Edit file
systemctl --user daemon-reload     # Reload configs (THIS IS NEEDED)
systemctl --user start postgresql  # Retry
systemctl --user status postgresql # Check again
In my case problem was using ~/postgre-data instead of /home/pavel/postgre-data as services files require full paths.
Now it will likely fail due to following error in ~/postgre-data/log/postgresql-Tue.log or similar:
1
FATAL:  could not create lock file "/var/run/postgresql/.s.PGSQL.5432.lock": Permission denied
Fix it by editing ~/postgre-data/postgresql.conf, you can add something like unix_socket_directories = '/home/pavel/postgre-sockets' and create directory by
1
mkdir ~/postgre-sockets
Start service again and verify it runs
1
2
systemctl --user start postgresql
systemctl --user status postgresql
Create database
1
psql -h ~/postgre-sockets -d postgres
Now some commands:
\l- list databases\c- connects to database weather_data\d- list all object\dt,\dv,\dm- list tables, views, materialized views\d object,\d+ object- details about object such as table structure (with plus more detailed, e.g. select for view)\q- quit
1
2
3
4
5
6
7
8
9
10
11
12
13
14
15
16
17
18
19
20
21
22
23
24
25
26
27
28
29
30
31
32
33
34
35
36
37
38
39
40
41
42
43
44
psql (16.3)
Type "help" for help.

postgres=# CREATE DATABASE weather_data;
CREATE DATABASE
postgres=# \l
                                                     List of databases
     Name     | Owner | Encoding | Locale Provider |   Collate   |    Ctype    | ICU Locale | ICU Rules | Access privileges
--------------+-------+----------+-----------------+-------------+-------------+------------+-----------+-------------------
 postgres     | pavel | UTF8     | libc            | en_US.UTF-8 | en_US.UTF-8 |            |           |
 template0    | pavel | UTF8     | libc            | en_US.UTF-8 | en_US.UTF-8 |            |           | =c/pavel         +
              |       |          |                 |             |             |            |           | pavel=CTc/pavel
 template1    | pavel | UTF8     | libc            | en_US.UTF-8 | en_US.UTF-8 |            |           | =c/pavel         +
              |       |          |                 |             |             |            |           | pavel=CTc/pavel
 weather_data | pavel | UTF8     | libc            | en_US.UTF-8 | en_US.UTF-8 |            |           |
(4 rows)

postgres=# \c weather_data
You are now connected to database "weather_data" as user "pavel"

weather_data=# CREATE TABLE weather_data (station_id TEXT NOT NULL, timestamp TIMESTAMPTZ NOT NULL, temperature REAL, humidity REAL, pressure_at_station REAL, dew_point REAL, pressure_at_sea_level REAL, specific_humidity REAL, PRIMARY KEY (station_id, timestamp));
CREATE TABLE
weather_data=# weather_data=# \dt
           List of relations
 Schema |     Name     | Type  | Owner
--------+--------------+-------+-------
 public | weather_data | table | pavel
(1 row)

weather_data=# \d weather_data
                            Table "public.weather_data"
        Column         |           Type           | Collation | Nullable | Default
-----------------------+--------------------------+-----------+----------+---------
 station_id            | text                     |           | not null |
 timestamp             | timestamp with time zone |           | not null |
 temperature           | real                     |           |          |
 humidity              | real                     |           |          |
 pressure_at_station   | real                     |           |          |
 dew_point             | real                     |           |          |
 pressure_at_sea_level | real                     |           |          |
 specific_humidity     | real                     |           |          |
Indexes:
    "weather_data_pkey" PRIMARY KEY, btree (station_id, "timestamp")
weather_data=# \q
Populate database with data from JSONL
Now we have data as:
1
tail -n 3 ~/dev-py/pico_weather_station/server/log_sta01.txt
1
2
3
{"station_id": "sta01", "time": "2025-01-07T19:25:10Z", "temperature": 20.85, "pressure": 98082.5, "humidity": 41.92, "time_of_arrival": "2025-01-07T19:25:13Z", "dew_point": 7.445809063077524, "sea_level_pressure": 101042.15400010579, "specific_humidity": 0.006576569910225681}
{"station_id": "sta01", "time": "2025-01-07T19:26:10Z", "temperature": 20.85, "pressure": 98087.9, "humidity": 41.99, "time_of_arrival": "2025-01-07T19:26:15Z", "dew_point": 7.47052585396672, "sea_level_pressure": 101047.71694590754, "specific_humidity": 0.006587231631598269}
{"station_id": "sta01", "time": "2025-01-07T19:27:10Z", "temperature": 20.83, "pressure": 98087.9, "humidity": 41.93, "time_of_arrival": "2025-01-07T19:27:14Z", "dew_point": 7.431221762806983, "sea_level_pressure": 101047.71694590754, "specific_humidity": 0.006569699631174833}
Great surprise is that we can directly import json lines into temporary table:
1
2
3
4
5
6
7
8
9
10
11
12
13
14
15
16
17
18
19
20
21
22
23
24
25
26
27
28
29
30
31
32
33
34
35
36
37
38
39
40
41
42
43
44
45
46
47
48
49
50
51
52
53
54
55
56
57
58
59
60
61
62
63
64
65
66
67
68
weather_data=# CREATE TABLE staging_weather(data JSONB);
CREATE TABLE
weather_data=# \copy staging_weather(data) FROM '/home/pavel/dev-py/pico_weather_station/server/log_sta01.txt'
COPY 8641

weather_data=# SELECT * FROM staging_weather LIMIT 3;
                                                                                                                                        data
-------------------------------------------------------------------------------------------------------------------------------------------------------------------------------------------------------------------------------------------------------------------------------------
 {"humidity": 41.61, "pressure": 99844.2, "dew_point": 7.201499019325195, "station_id": "sta01", "temperature": 20.7, "time_of_arrival": "2025-01-01T09:59:01Z", "specific_humidity": 0.006353036253276765, "sea_level_pressure": null}
 {"humidity": 41.65, "pressure": 99834.4, "dew_point": 7.197495987284344, "station_id": "sta01", "temperature": 20.68, "time_of_arrival": "2025-01-01T10:01:26Z", "specific_humidity": 0.006351908414054874, "sea_level_pressure": null}
 {"time": "2025-01-1T17:01:55Z", "humidity": 41.84, "pressure": 99396.9, "dew_point": 7.911985825781336, "station_id": "sta01", "temperature": 21.4, "time_of_arrival": "2025-01-01T17:01:54Z", "specific_humidity": 0.006700018998227196, "sea_level_pressure": 102396.21621525873}

weather_data=# INSERT INTO weather_data (
    station_id,
    timestamp,
    temperature,
    pressure_at_station,
    humidity,
    dew_point,
    pressure_at_sea_level,
    specific_humidity
)
SELECT
    data->>'station_id' AS station_id,
    (data->>'time')::timestamptz AS timestamp,
    (data->>'temperature')::real AS temperature,
    (data->>'pressure')::real AS pressure_at_station,
    (data->>'humidity')::real AS humidity,
    (data->>'dew_point')::real AS dew_point,
    (data->>'sea_level_pressure')::real AS pressure_at_sea_level,
    (data->>'specific_humidity')::real AS specific_humidity
FROM staging_weather
WHERE
    -- Required fields are not NULL or empty
    data->>'station_id' IS NOT NULL AND
    data->>'time' IS NOT NULL AND
    -- Validate time format (invalid times will raise errors)
    data->>'time' ~ '^\d{4}-\d{2}-\d{2}T\d{2}:\d{2}:\d{2}Z$' AND
    -- Validate the year is greater than 2023
    EXTRACT(YEAR FROM (data->>'time')::timestamptz) > 2023 AND
    -- Optional validation for numeric fields (e.g., temperature)
    (data->>'temperature')::real IS NOT NULL AND
    (data->>'pressure')::real IS NOT NULL AND
    (data->>'humidity')::real IS NOT NULL;
INSERT 0 4984

weather_data=# SELECT *
FROM weather_data
ORDER BY timestamp ASC
LIMIT 3;
 station_id |       timestamp        | temperature | humidity | pressure_at_station | dew_point | pressure_at_sea_level | specific_humidity
------------+------------------------+-------------+----------+---------------------+-----------+-----------------------+-------------------
 sta01      | 2025-01-04 09:02:22+01 |       20.55 |       42 |             99276.9 |  7.201829 |             102272.59 |       0.006389626
 sta01      | 2025-01-04 09:03:22+01 |       20.72 |    41.74 |             99276.6 | 7.2650166 |             102272.29 |      0.0064174873
 sta01      | 2025-01-04 09:04:22+01 |       20.67 |    41.68 |             99283.9 | 7.1989737 |            102279.805 |      0.0063879155
(3 rows)

weather_data=# SELECT *
FROM weather_data
ORDER BY timestamp DESC
LIMIT 3;
 station_id |       timestamp        | temperature | humidity | pressure_at_station | dew_point | pressure_at_sea_level | specific_humidity
------------+------------------------+-------------+----------+---------------------+-----------+-----------------------+-------------------
 sta01      | 2025-01-07 20:33:10+01 |       20.86 |    41.94 |             98082.5 |  7.461932 |             101042.16 |      0.0065837624
 sta01      | 2025-01-07 20:32:10+01 |       20.86 |       42 |               98094 |  7.483131 |                101054 |      0.0065924427
 sta01      | 2025-01-07 20:31:10+01 |       20.83 |    42.01 |               98086 |  7.459435 |             101045.76 |      0.0065824124

(3 rows)
Now we had malformed entries with date such as 2025-01-1 so we can insert them by modifying mask (not shown here)
1
    data->>'time' ~ '^\d{4}-\d{2}-\d{1}T\d{2}:\d{2}:\d{2}Z$' AND
and verify:
1
2
3
4
5
6
7
8
9
10
11
12
13
14
15
16
INSERT 0 3633
weather_data=# select count(*) from weather_data;
 count
-------
  8617
(1 row)
weather_data=# SELECT *
FROM weather_data
ORDER BY timestamp ASC
LIMIT 3;
 station_id |       timestamp        | temperature | humidity | pressure_at_station | dew_point | pressure_at_sea_level | specific_humidity
------------+------------------------+-------------+----------+---------------------+-----------+-----------------------+-------------------
 sta01      | 2025-01-01 18:01:55+01 |        21.4 |    41.84 |             99396.9 |  7.911986 |             102396.22 |       0.006700019
 sta01      | 2025-01-01 18:08:14+01 |       21.29 |    41.81 |             99380.9 |  7.802314 |            102379.734 |      0.0066513345
 sta01      | 2025-01-01 19:01:25+01 |        21.4 |    41.78 |             99345.5 | 7.8907237 |            102343.266 |      0.0066938475
(3 rows)
If something goes wrong
1
TRUNCATE TABLE weather_data;
and repeat. By the way order of fields in INSERT has to match order of fieds in SELECT.
Some more fun …
Aggregate data
The following command will generate a static table from last week. Unlike regular view, it has to be refreshed manually.
This is just for curiosity, for plotting data it might be better to create static image overnight. Regular view is the same without MATERIALIZED keyword.
1
2
3
4
5
6
7
8
9
CREATE MATERIALIZED VIEW hourly_station_pressure_last_week AS
SELECT
    station_id,
    date_trunc('hour', timestamp) AS hour,
    AVG(pressure_at_station) AS avg_pressure_station
FROM weather_data
WHERE timestamp >= NOW() - INTERVAL '168 hours'
GROUP BY date_trunc('hour', timestamp), station_id
ORDER BY hour;
Refresh command is
1
REFRESH MATERIALIZED VIEW hourly_station_pressure_last_week;
And command to delete it is
1
DROP MATERIALIZED VIEW hourly_station_pressure_last_week;
View data
1
2
3
4
5
6
7
SELECT
    hour,
    ROUND((avg_pressure_station*0.01)::NUMERIC,1) as press
FROM
    hourly_station_pressure_last_week
WHERE
    station_id = 'sta01';
1
2
3
4
5
6
7
8
9
10
11
12
13
14
15
16
          hour          | press
------------------------+-------
 2025-01-01 18:00:00+01 | 993.9
 2025-01-01 19:00:00+01 | 993.4
 2025-01-01 20:00:00+01 | 993.1
 2025-01-01 21:00:00+01 | 992.6
 2025-01-01 22:00:00+01 | 992.1
 2025-01-01 23:00:00+01 | 991.6
 2025-01-02 00:00:00+01 | 990.9
 2025-01-02 01:00:00+01 | 990.1
 2025-01-02 02:00:00+01 | 989.6
...
 2025-01-07 18:00:00+01 | 980.0
 2025-01-07 19:00:00+01 | 979.9
 2025-01-07 20:00:00+01 | 980.4
(147 rows)
We can export data to console in CSV format:
1
psql -h ~/postgre-sockets  -d weather_data -c "\copy (SELECT hour as datetime, avg_pressure_station*0.01 as pressure FROM hourly_station_pressure_last_week WHERE station_id = 'sta01') TO STDOUT WITH CSV HEADER"
1
2
3
4
5
6
datetime,pressure
2025-01-01 18:00:00+01,993.8889843750001
2025-01-01 19:00:00+01,993.3791369912791
...
2025-01-07 19:00:00+01,979.9069309895833
2025-01-07 20:00:00+01,980.4129710477941
And wait for it!
1
2
3
4
5
6
7
8
psql -h ~/postgre-sockets  -d weather_data -c "\copy (SELECT hour as datetime, avg_pressure_station*0.01 as pressure FROM hourly_station_pressure_last_week WHERE station_id = 'sta01') TO STDOUT WITH CSV HEADER" | gnuplot -e "
set term dumb 120 40;
set datafile separator ',';
set xdata time;
set timefmt '%Y-%m-%d %H:%M:%S';
set format x '%m-%d';
set title 'Hourly Pressure at STA01';
plot '-' using 1:2 with lines title 'Station Pressure';"
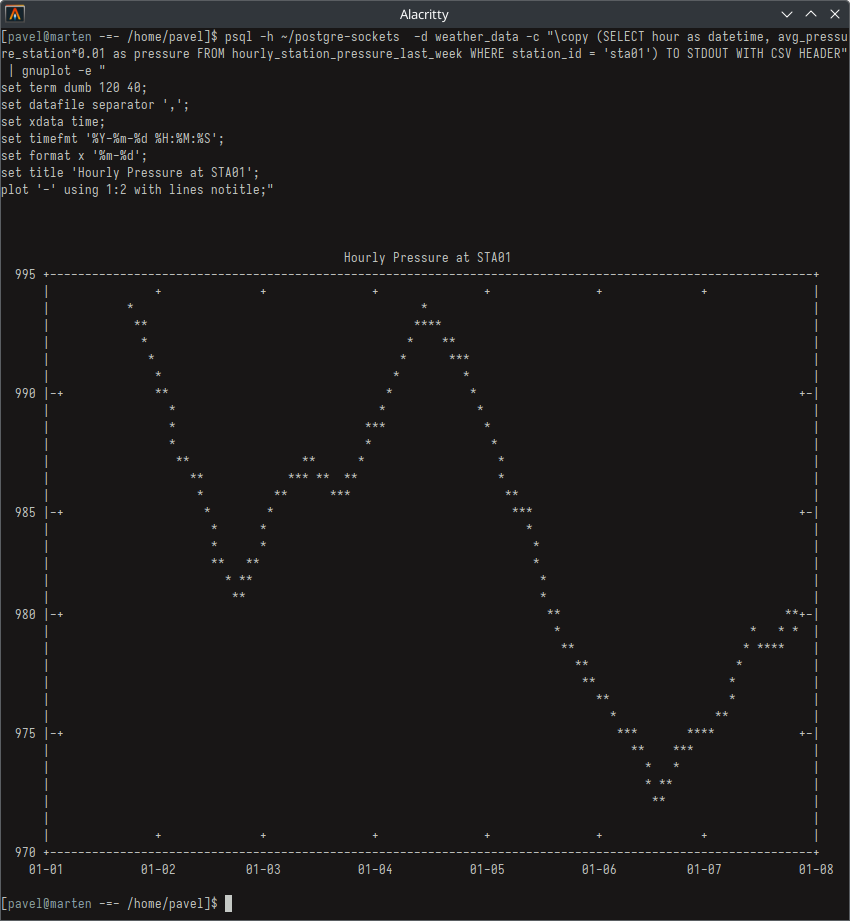 Weather graph from database
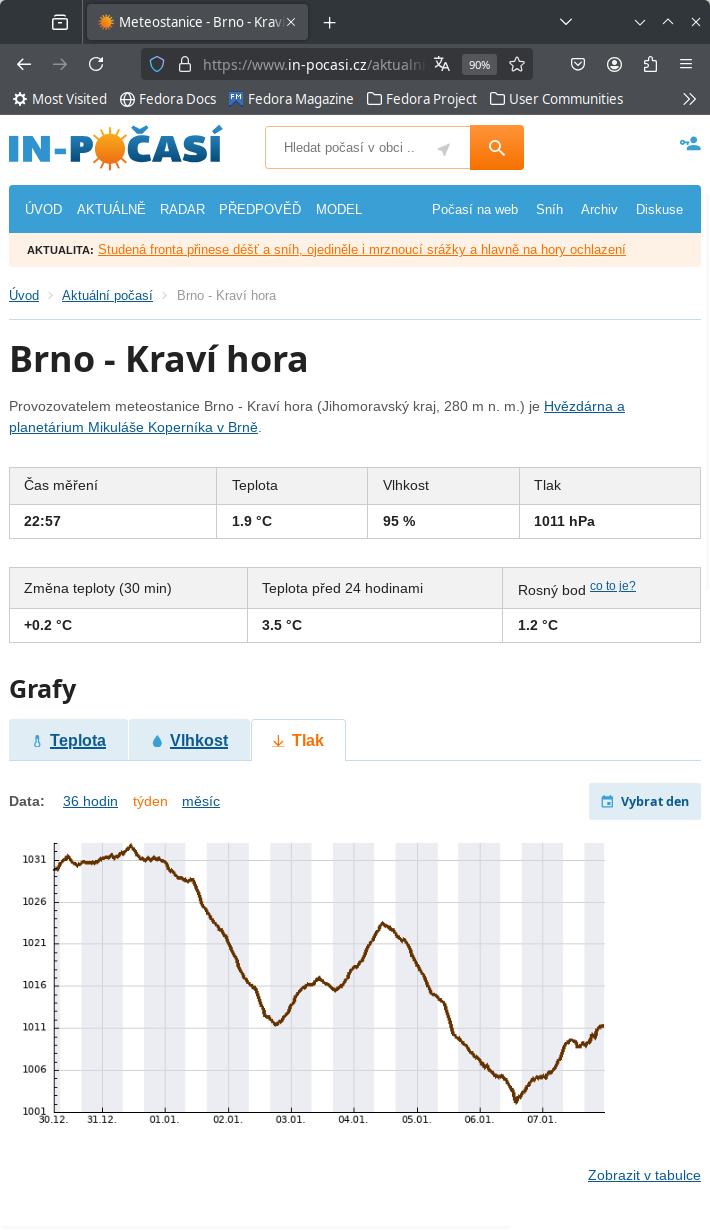 Weather graph from a nearby station
Add new data from JSONL
1
2
3
4
5
6
7
8
9
10
11
12
13
14
15
16
17
18
19
20
21
22
23
24
25
26
27
28
29
30
31
32
33
34
35
36
37
38
39
40
41
42
43
-- delete old data
TRUNCATE TABLE staging_weather;

-- import new data
\copy staging_weather(data) FROM '/home/pavel/dev-py/pico_weather_station/server/log_sta01.jsonl'

-- insert new recods
INSERT INTO weather_data (
    station_id,
    timestamp,
    temperature,
    pressure_at_station,
    humidity,
    dew_point,
    pressure_at_sea_level,
    specific_humidity
)
SELECT
    data->>'station_id' AS station_id,
    (data->>'time')::timestamptz AS timestamp,
    (data->>'temperature')::real AS temperature,
    (data->>'pressure')::real AS pressure_at_station,
    (data->>'humidity')::real AS humidity,
    (data->>'dew_point')::real AS dew_point,
    (data->>'sea_level_pressure')::real AS pressure_at_sea_level,
    (data->>'specific_humidity')::real AS specific_humidity
FROM staging_weather
WHERE
    -- Required fields are not NULL or empty
    data->>'station_id' IS NOT NULL AND
    data->>'time' IS NOT NULL AND
    -- Validate time format (invalid times will raise errors)
    data->>'time' ~ '^\d{4}-\d{2}-\d{2}T\d{2}:\d{2}:\d{2}Z$' AND
    -- Validate the year is greater than 2023
    EXTRACT(YEAR FROM (data->>'time')::timestamptz) > 2023 AND
    -- Optional validation for numeric fields (e.g., temperature)
    (data->>'temperature')::real IS NOT NULL AND
    (data->>'pressure')::real IS NOT NULL AND
    (data->>'humidity')::real IS NOT NULL
-- Unique constraint columns
ON CONFLICT (station_id, timestamp)
-- Skip existing rows
DO NOTHING;
Addendum: Fixing PSQL collation version mismatch (2025-04-23)
This was needed after Fedora major version upgrade.
1
2
3
4
5
6
7
8
9
10
11
12
13
14
15
16
17
18
19
20
21
22
23
24
25
26
27
28
29
30
31
32
33
[pavel@marten -=- /home/pavel/postgre-data]$ psql -h ~/postgre-sockets -d postgres
WARNING:  database "postgres" has a collation version mismatch
DETAIL:  The database was created using collation version 2.40, but the operating system provides version 2.41.
HINT:  Rebuild all objects in this database that use the default collation and run ALTER DATABASE postgres REFRESH COLLATION VERSION, or build PostgreSQL with the right library version.
psql (16.8)
Type "help" for help.

postgres=# \l
                                                     List of databases
     Name     | Owner | Encoding | Locale Provider |   Collate   |    Ctype    | ICU Locale | ICU Rules | Access privileges
--------------+-------+----------+-----------------+-------------+-------------+------------+-----------+-------------------
 postgres     | pavel | UTF8     | libc            | en_US.UTF-8 | en_US.UTF-8 |            |           |
 template0    | pavel | UTF8     | libc            | en_US.UTF-8 | en_US.UTF-8 |            |           | =c/pavel         +
              |       |          |                 |             |             |            |           | pavel=CTc/pavel
 template1    | pavel | UTF8     | libc            | en_US.UTF-8 | en_US.UTF-8 |            |           | =c/pavel         +
              |       |          |                 |             |             |            |           | pavel=CTc/pavel
 weather_data | pavel | UTF8     | libc            | en_US.UTF-8 | en_US.UTF-8 |            |           |
(4 rows)

postgres=# alter database weather_data refresh collation version;
NOTICE:  changing version from 2.40 to 2.41
ALTER DATABASE
postgres=# alter database postgres refresh collation version;
NOTICE:  changing version from 2.40 to 2.41
ALTER DATABASE
postgres=#
\q
[pavel@marten -=- /home/pavel/postgre-data]$ psql -h ~/postgre-sockets -d postgres
psql (16.8)
Type "help" for help.

postgres=#
\q
Conclusion
What makes this solution beautiful is its elegant simplicity, achieved by leveraging time-tested tools. PostgreSQL’s powerful capabilities handle time-series data and JSON ingestion through native features, eliminating the need for specialized databases or conversion scripts. The materialized views and timestamp operations provide efficient data handling without complex optimizations.
This approach embodies Unix philosophy by combining simple, effective tools that excel at specific tasks. No container orchestration, cloud services, or heavyweight frameworks required - just PostgreSQL for storage, systemd for automation, and gnuplot for visualization. The direct pipeline from database to graphs demonstrates how straightforward data visualization can be.
The result is a system that’s easy to understand, maintain, and modify, proving that many real-world problems require just thoughtful application of fundamental tools that will remain relevant for decades to come.
Lessons learned
I’m quite familiar with SQL databases - I used FirebirdSQL (former Borland Interbase) a lot between years 2002 and 2005 and Microsoft SQL around 2010. But each database has some specific functions, such as views, procedures, triggers, and details in syntax. Learning that I can import JSON directly and I can make materialized views with pre-processed results (such as aggregated historic data updated daily) was quite surprising, even though I knew it has a support for time series.
This part was actually more enjoyable than creating weather station, as it provided more surprises in short period of time and very satisfying solution, whereas with weather station I kind of knew what to expect and it was only putting relatively simple pieces together.
Alternatives
- Pythonic aproach is also perfectly valid option - for small ammount of data, processing and plotting data from JSONL files by pandas and seaborn (based on matplotlib) is possible.
- RRDTool is fast, minimalistic time series database with fixed data retention length and database size - however, it does not offer any flexibility. This tool was popular 20 years ago for plotting network traffic using MRTG
- InfluxDB, Prometheus, Grafana, Timescale (build on top of PostgreSQL) - I did not explored these. For me they are overkill.